What an odd and interesting day Thursday was! All day long it looked like the stock market was going to bring gains to long-positioned investors — until the drop at the very end, that is.
That’s so typical of the markets. They get your hopes up, just to bring you right back down to earth. The major market indexes were basically flat by the end of the trading session on Thursday, though option sellers were undoubtedly pleased with this.
At least a few stocks made pretty sizable moves, however, even on a day that disappointed folks looking for serious market action. And so, please allow me to present to you three big stock charts that stood out with outsized movements on a flat-line kind of day.
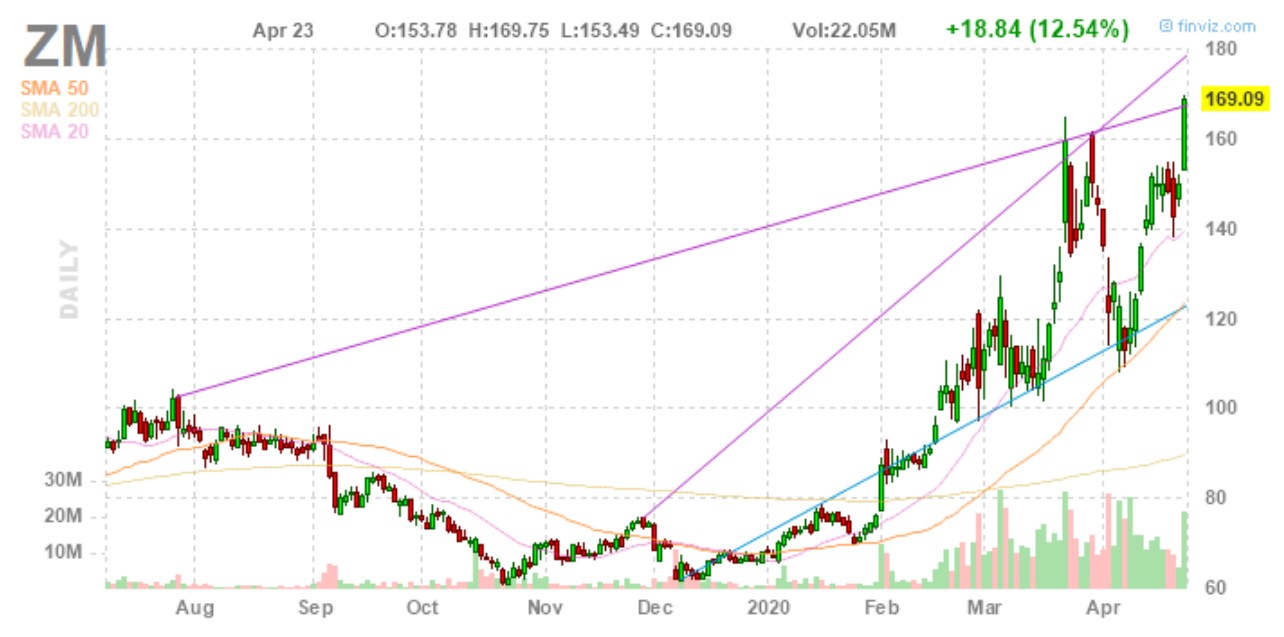
Zoom (ZM)

Video conferencing is a hot topic because the novel coronavirus has kept many people indoors and unable to communicate face-to-face. Zoom (NASDAQ:ZM) stock has fared well because of this recent phenomenon. Even so, Thursday’s price movement was rather impressive.
- A close look at the tall green candle on Thursday shows that there’s no lower wick and not much of an upper wick. This implies a steady upward movement of the ZM stock price throughout the trading session.
- ZM stock is above all three of the major moving averages: the 20-, the 50-, and the 200-day moving averages, to be specific. Plus, all three of those moving averages are trending upwards.
- Moreover, the stock just broke above a resistance line that has been there for quite a while. $160 is now to be considered as a support level. All in all, the outlook is bullish regarding ZM stock.
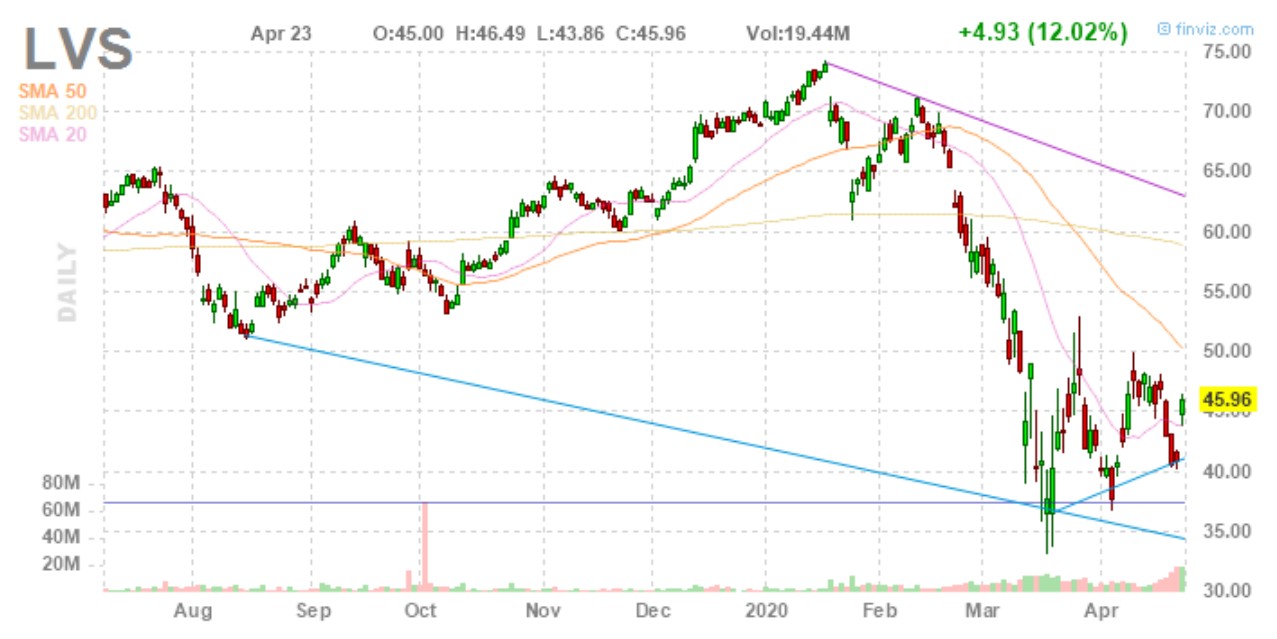
Las Vegas Sands (LVS)

It certainly hasn’t been an easy year so far for investors in Las Vegas Sands (NYSE:LVS) stock. The last thing that most people are thinking about during a pandemic is gambling at a casino or relaxing at a resort. Thursday’s price move, however, may have brought some promise of a brighter future.
- The body of Thursday’s candlestick might not look like anything to write home about. Yet, you’ll see a sizable gap up in LVS stock. In addition, the candle’s lower wick suggests that the sellers tried to push it down but failed.
- It’s encouraging to see that LVS stock is above the 20-day moving average. The next milestones are the 50- and the 200-day moving averages, which the bulls should monitor closely.
- A symmetrical triangle chart pattern is forming for LVS stock. That implies tightening price movement and therefore a breakout could be in the cards. Soon enough we’ll know whether Thursday’s upward momentum will continue.
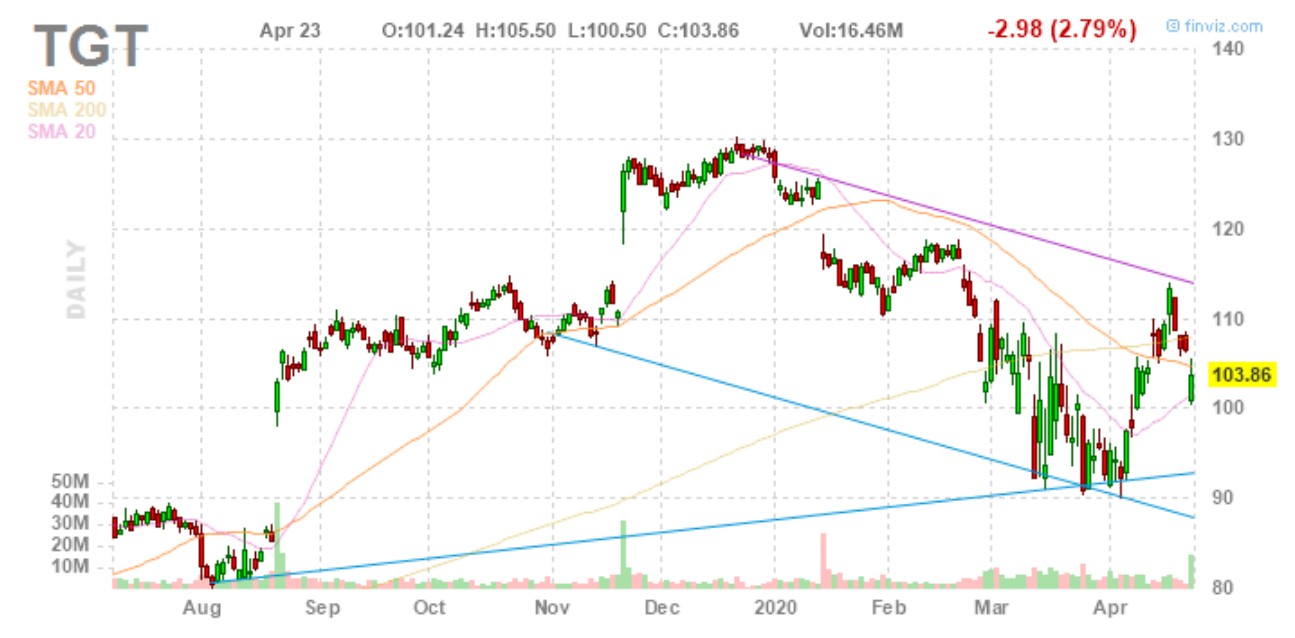
Target (TGT)

Shoppers often look to Target (NYSE:TGT) for essential supplies. The spread of the coronavirus has put Target into focus as a possible beneficiary of the frantic stockpiling craze. Still, the action in TGT stock on Thursday was a real eye-opener and might be a cause of concern for long-leaning traders. Let’s dive in to the last of today’s big stock charts.
- A candlestick can tell a whole story, and that’s definitely the case with Thursday’s candle for TGT stock. We can see that there was a gap down in the morning, followed by an attempt at a recovery as indicated by the upper wick. Still, the recovery attempt was only partially successful.
- Like it or not, TGT stock is struggling with all three of the major moving averages. It’s barely above the 20-day moving average and hitting resistance at the 50-day moving average. It could be a while before it’s ready to pierce above the 200-day moving average.
- There’s a downward-trending channel in effect. TGT stock is in the middle of the channel, so that’s neutral. But the fact that it’s a downward-leaning channel is still not a positive sign for the bulls.
As of this writing, David Moadel did not hold a position in any of the aforementioned securities.
