Many investors nowadays are bemoaning that their tried and true stock-market indicators have stopped working. For example: No one at the beginning of the year had a clue that the Dow Jones Industrial Average
DJIA,
was about to turn in its worst first-half performance since 1962. Since then, many investing experts have predicted the end of the market’s slide. So far they’ve been outright wrong or extremely premature.
It’s possible that your favorite indicator indeed has stopped working. But simple bad luck is the more likely explanation for why it appears to be out of synch with the market.
Such frustration occurs in every bear market. When the market’s major trend is down, the winner is who loses the least. So while it can seem that the market has suddenly become inscrutable, all that’s really happened is that we’re in a bear market.
Be real
I was reminded of this at a seminar earlier this week led by Dan Villalon, principal and global co-head of the Portfolio Solutions Group at AQR Capital Management. Villalon reported on research which measured the likelihood that a market-beating strategy will hurdle various performance measures.
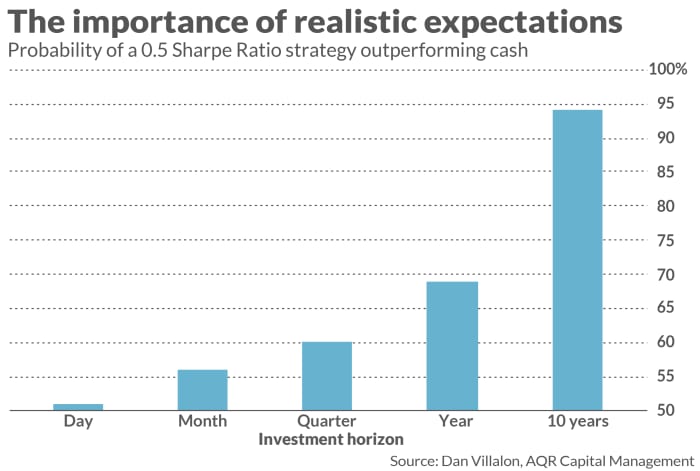
He focused on a hypothetical investment strategy with a Sharpe Ratio of 0.50. The Sharpe Ratio is a measure of risk-adjusted performance, and a 0.50 ratio is ahead of the stock market itself, whose Sharpe Ratio historically has been closer to 0.40. The chart below reports what he found.

In any given trading session, the chances that this market-beating strategy will outperform risk-free cash are just 51%. That’s barely better than a coin flip, confirming that the market’s daily gyrations are largely random. But notice that the odds don’t grow dramatically as you extend your investment horizon. At the quarterly horizon, Villalon found, there’s a 60% chance the strategy will beat cash over any randomly picked three-month period. At the yearly horizon, the odds are no better than 69%. Only at the 10-year horizon do the odds rise to 94%.
The investment implication: Investors need to develop realistic expectations about what is achievable. Even when they are lucky enough to be following a market-beating strategy, over individual days, weeks, months, quarters and even years they still should expect to underperform not just the market, but cash.
Benefit of the doubt
The corollary of this investment implication: Lagging the market and underperforming cash is not a reason to believe your strategy or indicator is no longer valid.
This was shown by a study several years ago by University of Chicago finance professor Eugene Fama and Dartmouth professor Ken French. In their study, which appeared in the Financial Analysts Journal in 2018, they found that, over periods as long as a decade, there’s a considerable chance that market-beating strategies will lose.
To reach this conclusion, the professors ran the following simulation: In each of 120 consecutive months, assume that a strategy’s return is equal to what it was in a randomly selected month from the past five decades. Running this simulation 100,000 times, they calculated how often the strategy lagged the market.
To illustrate, consider the value investment style, which picks stocks with low ratios of price to fundamental value (as opposed to growth stocks, which trade for high ratios). Even though value has handily beaten growth over the past century, through the end of 2021 it had famously lagged for at least a decade — the longest sustained period of lagging performance in the historical record.
Fama and French found that this is not surprising: In their simulations, 10-year losses for the value strategy occurred 9% of the time. The odds of a loss over even a 20-year horizon, while smaller, are still “non-trivial” — due to nothing more than luck alone.
The bottom line? As French put it to me in an interview several years ago, when an indicator or strategy appears to stop working, “statistical noise — luck, in other words — is always the first possibility to consider.”
Mark Hulbert is a regular contributor to MarketWatch. His Hulbert Ratings tracks investment newsletters that pay a flat fee to be audited. He can be reached at mark@hulbertratings.com
Plus: Stocks could drop 50%, Nouriel Roubini argues. Things will get much worse before they get better.
