Anyone watching the market knows stocks have been hammered since the Federal Reserve began in March what has turned into an aggressive series of interest rate hikes, but strategists at Deutsche Bank say they might be surprised to learn that those rate hikes probably aren’t the culprit.
The S&P 500
SPX,
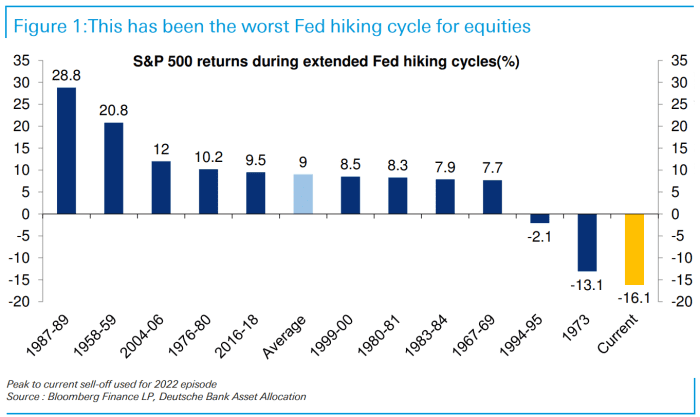
has seen a return of negative 16.1%, at its current level, since the rate increases began. That’s the worst performance for an extended cycle of rate hikes since at least the late 1950s, according to a team led by Chief Strategist Binky Chadha in a Monday note (see chart below).

Deutsche Bank
The chart highlights what may be a surprise to many investors: rate hike cycles, historically, haven’t been a negative for stocks. Of the 11 previous hiking cycles dating back to 1958-59, only two (1994-95 and 1973), produced negative returns. On average, rate-hike cycles have produced a 9% return for the S&P 500.
Any misconception that rate-hike cycles have tended to be negative for stocks was probably reinforced by the market’s ugly 2022 performance, but a closer look at the tape shows why that conclusion doesn’t hold up, Chadha and his team wrote:
In contrast to most historical rate hiking cycles, which saw a positive correlation between Fed rates and equities (median +61%; 8 of 10 positive), this cycle has seen it run strongly negative (-68%). This negative correlation naturally suggests higher rates lowered equities, reinforcing the widely held belief. A closer look though reveals that the S&P 500 has been at current levels 4 times over the last 5 months, while rates have been successively and notably higher each time, with the 2y yield up 175bps (basis points) from the first time. This contradicts the view that higher rates drove the S&P 500 selloff, or at least show that the last 175bps higher in rates have not lowered the S&P 500.
So if sharp interest rate rises aren’t the driver, what is behind the selloff?
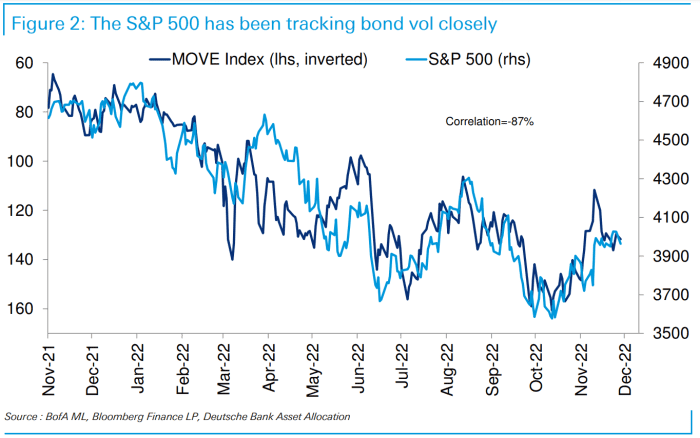
The Deutsche Bank analysts suspect it’s more about volatility in the bond market, which has seen a sustained rise since the Fed began raising rates. That’s unusual, they said, with rates volatility typically spiking in the run-up to and around the initial Fed hike and around changes in the speed of hikes during the cycle, then quickly dissipating.
Treasury-yield volatility, as measured by the ICE BofA MOVE Index, hasn’t tended to rise in a sustained manner during rate-hike cycles, they wrote, with the one exception being the 1973 hiking cycle, which was the only one that also saw a significant stock-market selloff.
Indeed, when rates and rate volatility have diverged in the current cycle, the stock market has inversely tracked the move in volatility rather than the level of yields, the analysts noted. For examples, they pointed to June, when volatility rose and equities fell sharply while yields rose modestly; August, when yield volatility fell even as yields rose; and the recent stretch, which has seen equities rally alongside a decline in yield volatility while yields have been rangebound (see chart below).

Deutsche Bank
“The selloff in equities during this rate hiking cycle has been driven, in our reading
more by rising rates vol than it has by the higher level of rates, in what is a strong parallel with the only other rate hiking cycle (1973) that previously saw equities fall significantly,” the strategists wrote. “Vol” is market shorthand for volatility.
So the key question for investors is whether yield volatility will fall. Chadha and his team think it probably will, for two reasons: a slower and more “deliberate” speed of Fed hikes ahead; and the fact that rates have already seen a significant rise, pushing them closer to where they will peak, even if they will get there only gradually.
Volatility across asset classes tends to be highly correlated, they said, and paced by a common driver, which in this case has been the result of frequent changes in Fed guidance and the speed of rate hikes.
That means a decline in yield volatility should see a decline in stock-market volatility, with systematic strategists set to raise equity exposure from extremely low levels and indicating the market rally has further to go, they said.
Stocks were flat to slightly lower in lackluster trade Tuesday, with the S&P 500 down 0.1%, while the Dow Jones Industrial Average
DJIA,
up 15 points, or less than 0.1%.
