Friday wrapped up another volatile week in the markets. The CBOE S&P 500 Volatility Index remained in the high $40-range, suggesting continued trepidation among the trading community.
When the price action is wild, investors may look to trend lines for support levels from our big stock charts. These lines can serve as guideposts for technical traders.
Please be aware, however, that no trendline support level is 100% foolproof. A breakdown can happen at any moment. With that in mind, Monday’s big stock charts focus on names that, for the moment, appear to have solid trendline support.
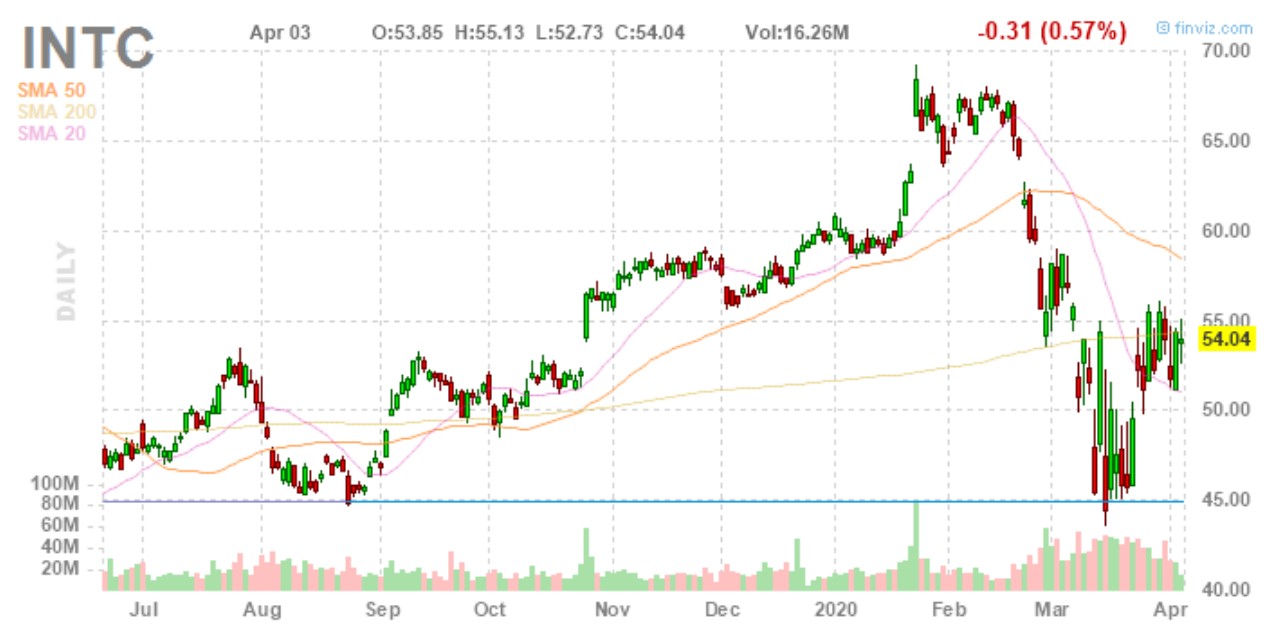
Intel (INTC)
The semiconductor industry didn’t fare well in March, and Intel (NASDAQ:INTC) stock was dragged down with the entire sector. Does the first of Monday’s big stock charts tell a more auspicious tale?
- Friday’s candlestick formed a spinning top with sizable upper and lower wicks. Evidently, the market is still deciding which way this stock should go.
- $45 is definitely the “line in the sand” for this one. Horizontal trend lines are sometimes more powerful than slanted ones. This trend line could act like a springboard in the future.
- Short-term resistance is at $55. Until further notice, consider playing the range between $45 and $55.
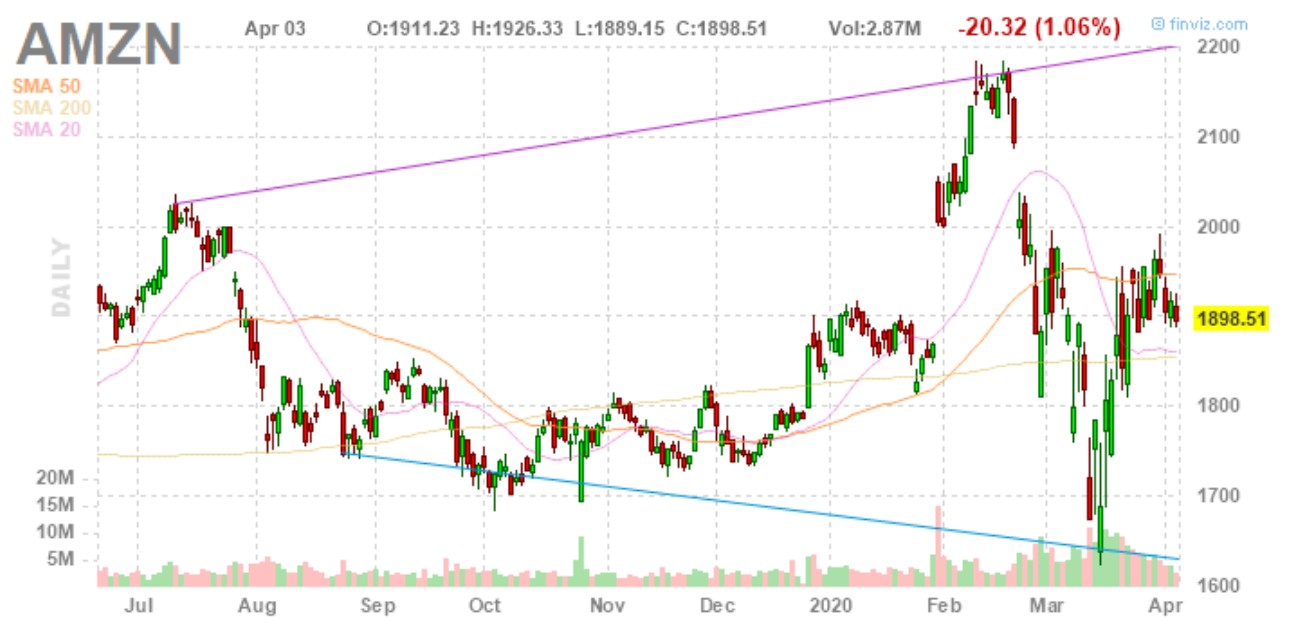
Amazon (AMZN)
While some retail-sector stocks have sunk to fresh lows, Amazon (NASDAQ:AMZN) stock has held up comparatively well. Will there be a delivery of profits coming soon?
- There’s a gigantic megaphone pattern going on here. The price is right smack in the middle of it. So, the outlook is neutral.
- The number $2,000 has psychological significance (lots of zeros there). Therefore, look for a momentum if there’s a close above $2,000 on heavy volume.
- For value-oriented traders, there’s moderate support at $1,700. You might consider scooping up some shares (or call options if you can’t afford the shares) at that level.
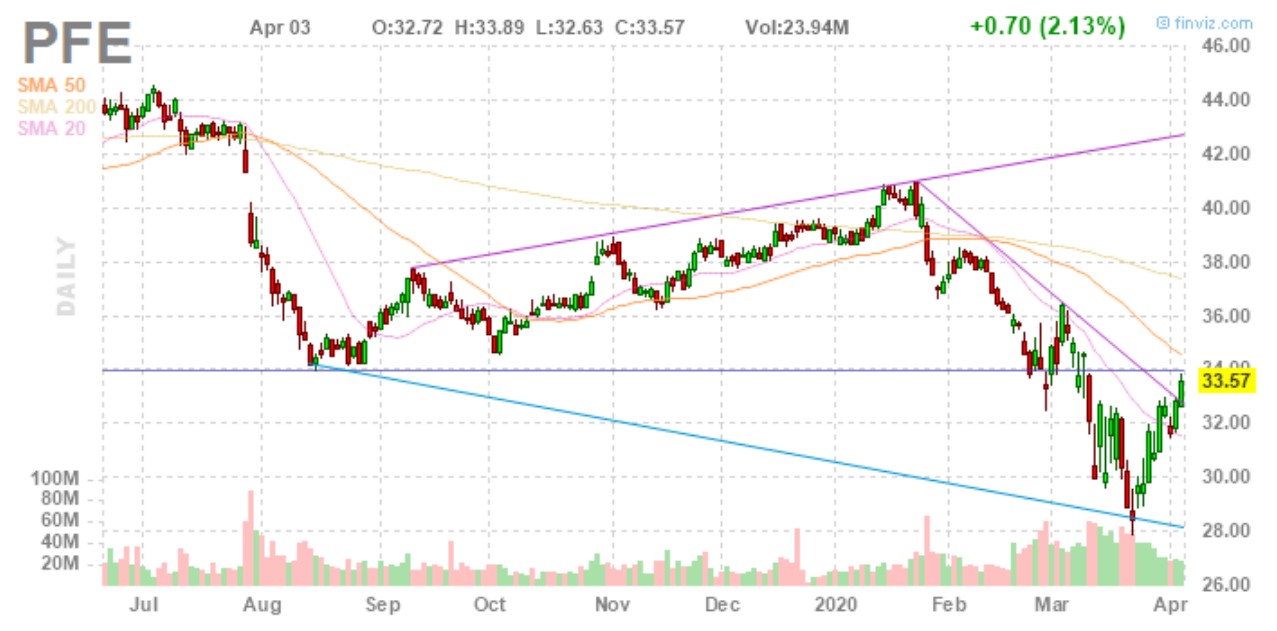
Pfizer (PFE)
The final stock in our big stock charts is Pfizer (NYSE:PFE). Folks seeking to trade based on the progress of the coronavirus from China are watching Pfizer stock carefully. But are we seeing progress in the price action of this drugmaker’s stock shares.
- We’ve got another megaphone pattern here, though it’s not as wide as Amazon’s. Friday’s candlestick is fairly close to the vertical middle of the megaphone, so the outlook appears to be neutral.
- The bottom trend line of the megaphone is at $28 now. If the price gets there, consider accumulating shares. But be advised that it’s a slanted trend line, so it should continue to go lower.
- $34, formerly support, is now hard resistance. The bulls really want to see a firm close above that price point in the near future.
As of this writing, David Moadel did not hold a position in any of the aforementioned securities.


