The past two months have brought relief and recovery to airline stocks. Boeing (NYSE:BA) has been bid up alongside the industry allowing Boeing stock bulls to establish a foothold.

With the turnaround, the price trend has improved dramatically and looks healthier than at any point in 2020. Today we’re taking a closer look at the price levels that matter for Boeing stock moving into the new year.
Ever since March blew up the stock market, airline stocks have been tied at the hip. The correlation between air carriers has always been positive, but the degree to which they move together reached a whole new level in the wake of the global pandemic.
Boeing also began moving with the group and its high correlation continues to this day.
For that reason, it’s worth analyzing the entire industry alongside Boeing stock. Until the economy fully recovers and we see companies start trading more on their individual fundamentals, it’s a good bet the link between the two will persist.
JETS Turbulent Flight and Boeing Stock

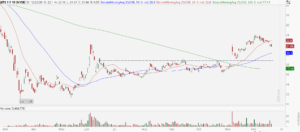
The infamous Nov. 9 rally was a game changer for risk assets – airlines included. The Street’s new favorite ETF for the space is the US Global Jets ETF (NYSEARCA:JETS).
Last month’s mega-pop finally carried JETS past its 200-day moving average and multiple resistance zones. Optimists are hoping the bottom is in and a smooth uptrend will return us to $30 and beyond. I’m skeptical that we will see such a quick trip, however.
Air traffic is still down dramatically and the fundamentals of many carriers looks terrible. As a result, I suspect the recovery will be riddled with turbulence. Monday’s whack is a perfect example. Heavy selling caused JETS to fall back below its rising 20-day moving average for the first time since October.
Tuesday didn’t improve matters much. We failed to take out Monday’s high and at the time of this writing, JETS is down another 1.5%.
The next two support zones come into play at $20 and $19. This dip will eventually be a buying opportunity, but I’m not itching to pull the trigger just yet.
Boeing Stock Charts

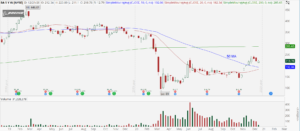
With the industry’s posture now in context we can cast a more discerning eye at the recent Boeing bounce. But, perhaps “bounce” doesn’t do the turnaround justice.
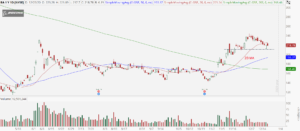
BA stock has rallied 72% off the October low, reversing both its daily and weekly downtrend in the process. The past few weeks of selling are well-deserved after such a red-hot run. As far as the weekly trend is concerned, this selling appears nothing more than a garden variety retracement. As long as we don’t breach $192, the newfound weekly uptrend remains intact.

The depth of the pullback does show some weakening in the daily uptrend with the recent break of the 20-day moving average. I like using Monday’s low as the line in the sand for when to pull in the horns even more. We bounced back strong from Monday’s down open, ending with a compelling bullish candle. Let’s call $210 the new support zone that we need to stay above to keep a short-term bullish outlook alive.
Before entering a new long trade, however, I suggest waiting to see if prices can reclaim the high side of the 20-day moving average. We got rejected on the first attempt in early-morning trading on Tuesday.
Long Call Spreads
With our battle lines drawn for short-term traders, it’s easy to create a simple “if-then” type of trade. If BA stock closes above the 20-day (near $225), then you can pull the trigger on bull plays. Waiting for confirmation that the next upswing has arrived prevents us from catching a falling knife.
Implied volatility is in the tank at the 13th percentile, so I prefer buying calls over selling puts once we push above $225.
The Trade: Buy the Feb $230/$240 bull call spread.
The cost should be around $3.50 to $3.75 when the stock triggers.
On the date of publication, Tyler Craig did not have (either directly or indirectly) any positions in the securities mentioned in this article.
For a free trial to the best trading community on the planet and Tyler’s current home, click here!
