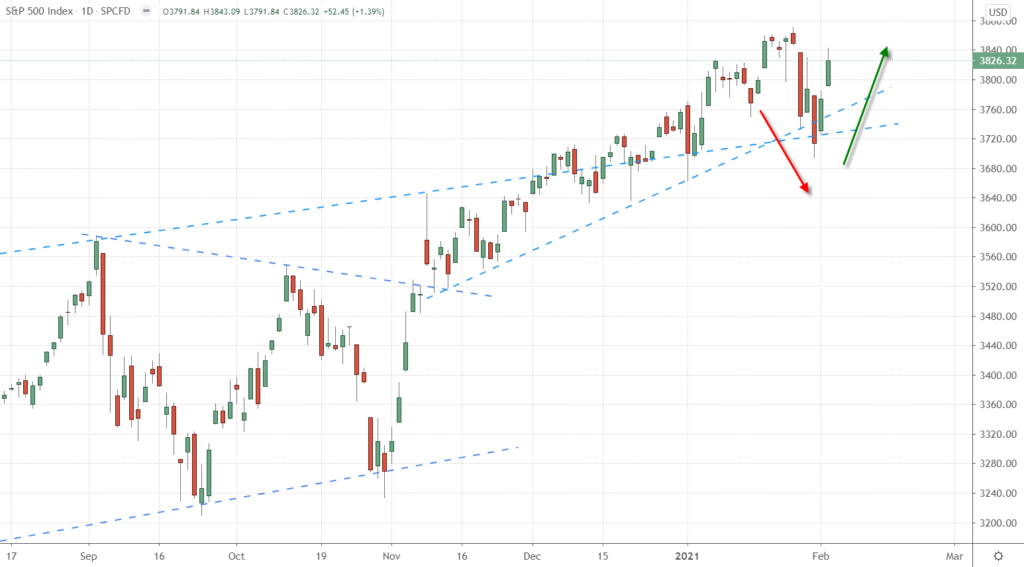
In the stock market, the questions that flash through every trader’s mind when the S&P 500 has a bearish week go something like this:
“What if this is it?”
“What if this is the end of the bullish rally?”
“What if the bears are waking up and taking control?”
Those questions flashed through the minds of many traders at the end of last week when the S&P 500 fell for the fourth time in a week and dipped below 3,700 for the first time since early January (see Fig. 1 below).
However, we think those worries are premature. Sure, there was some profit taking last week, but the index is already starting to rebound.
Just as Punxsutawney Phil saw his shadow yesterday and predicted six more weeks of winter, we are expecting the bears on Wall Street to keep on hibernating.
The CBOE Volatility Index (VIX)
So, why do we think last week’s pullback was just bullish profit taking instead of the beginning of a bearish pullback?
Well, because Wall Street isn’t nearly nervous enough.
If Wall Street was really worried the bears were ready to start driving the trend, the CBOE Volatility Index (VIX) would be rising to new highs, not falling back to support (see Fig. 2 below).
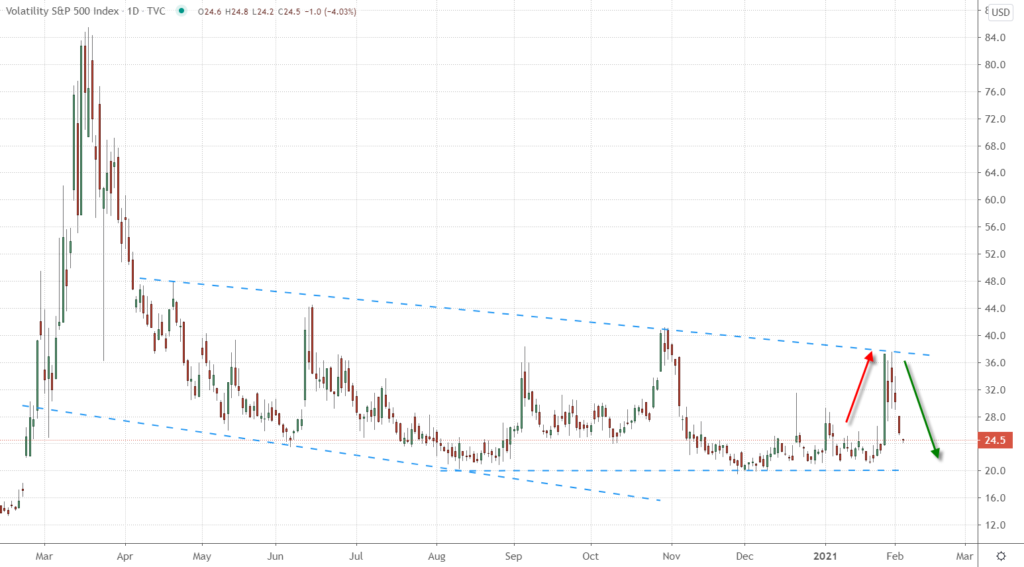
The VIX jumped last week as stocks were falling, but it failed to break 40, which is the level the index breached when it shot higher in late October 2020.
Seeing the VIX form a lower high and then drop right back down toward support at 20 is a great sign that traders aren’t forecasting long-term volatility.
Corporate Earnings in the Stock Market
So, why isn’t Wall Street worried?
Traders have been reassured that companies were growing their profits through the end of 2020 and will likely be able to continue growing their profits in 2021 as the U.S. economy continues to recover from the novel coronavirus pandemic.
Let’s start by looking at how companies are currently doing.
As you can see in Fig. 3 below, out of the nearly 40% of S&P 500 companies that have reported their Q4 2020 earnings, 82% of them have beaten earnings expectations.
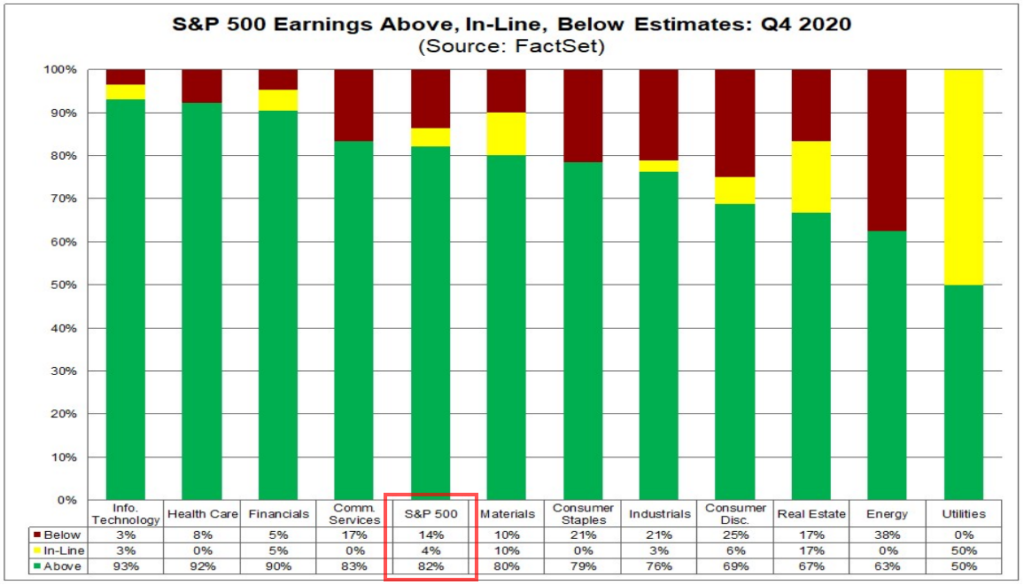
Seeing earnings growth like this across the stock market — with information technology, healthcare and financial stocks leading the way — has shown Wall Street that even though coronavirus cases started spiking in late 2020, Corporate America was able to weather the storm.
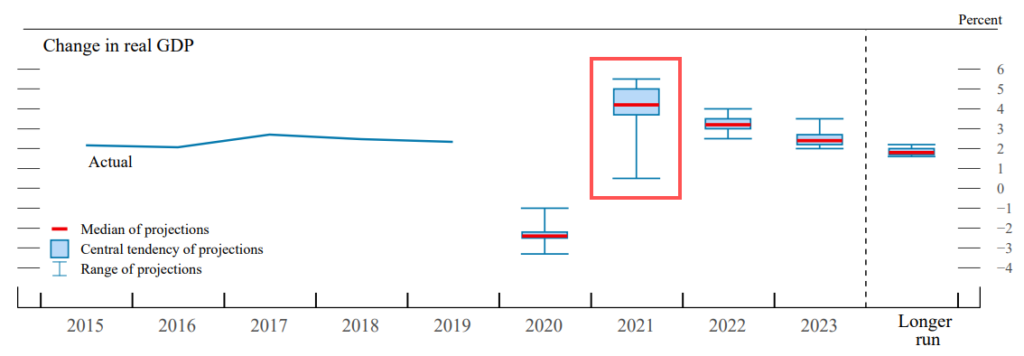
This strong Q4 performance is increasing traders’ confidence in the Federal Reserve’s median projection that the U.S. economy is going to grow by 4.2% during 2021 (see Fig. 4 below).
You can tell that traders across the board are confident in the economic outlook for the United States because it is not just stock prices that are rallying.
Treasury Yields
Bond traders are pushing Treasury yields higher once again in anticipation of stronger economic growth spurring increased inflationary pressure in the United States. You can see this in the 10-year Treasury Yield (TNX) chart in Fig. 5 below.
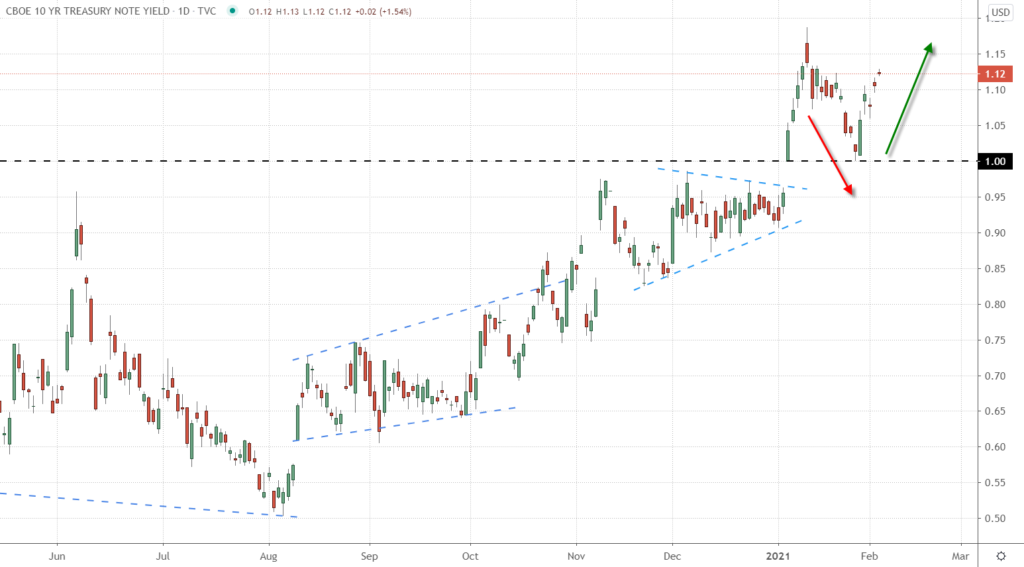
After breaking up through 1% on Jan. 6, the TNX dropped back to test this former resistance level and see if it would hold up as a new support level. As you can see by the rally on Jan. 28, support at 1% held nicely, and yields are continuing to climb.
Commodity traders are also pushing crude oil prices higher in anticipation of increased economic activity during 2021, driving up demand for gasoline and other oil-based fuels. You can see this in the crude oil futures chart in Fig. 6 below.
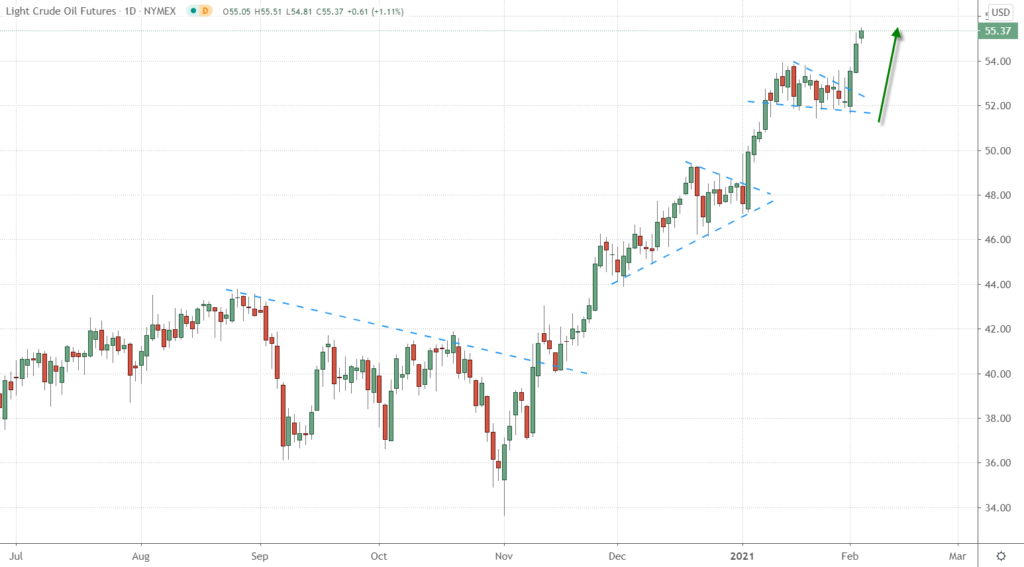
After consolidating in a bullish wedge continuation pattern for the past few weeks, crude oil prices have broken out higher and could easily be headed toward $60 per barrel.
We wouldn’t be surprised to see the S&P 500 consolidate for a bit between 3,700 and 3,875, but ultimately, we are looking for the index to once again break up to new highs.
On the date of publication, John Jagerson & Wade Hansen did not hold (either directly or indirectly) any positions in the securities mentioned in this article.
John Jagerson & Wade Hansen are just two guys with a passion for helping investors gain confidence — and make bigger profits with options. In just 15 months, John & Wade achieved an amazing feat: 100 straight winners — making money on every single trade. If that sounds like a good strategy, go here to find out how they did it.
