Opendoor Technologies (NASDAQ:OPEN) just released its Q4 financials on Feb. 24, including its full-year 2021 results. The home-buying company (which is now its main activity) produced losses and essentially leveraged the company. No wonder then that OPEN stock has cratered.

Moreover, it is likely to stay down as long as the company keeps digging itself into a hole. OPEN stock peaked at $24.75 on Nov. 1, 2021. But after the Q3 earnings came out on Nov. 10 the stock started dropping like a rock.
It’s now hovering at the exact level of its one-year low. This means that OPEN stock is down 67% from its highs in November 2021.
And that is just in the space of three months or so. This shows that the stock is in a massive correction. How should we interpret it otherwise?
Well, one way is to say the market is not impressed with the company’s current strategy. Let’s look at this further.
Where Things Stand at Opendoor Technologies
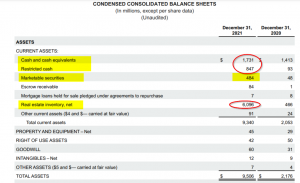
First, let’s look at the balance sheet. To simplify things, we can say that it has $2.5 billion in cash and restricted cash as well as almost $500 million in securities plus $6.1 billion in homes on its asset side. You can see this in the circled items I have shown in the asset balance sheet on the right.
But to finance this, Opendoor Technologies now has $7.2 billion in debt (up from $623 million last year), plus $2.2 billion in equity.
You can see this in the balance sheet analysis I have prepared on the right. So, in effect, all that the company has done this year is leverage up its balance sheet. But did it do this by making profits with its home sales?
The answer is decidedly “no.” This is apparent both from the income statement and from the cash flow statement.
For example, the company lost $191 million in Q4 in net income and an adj. net loss of $80 million. But for the full year, it lost $116 million on an adjusted basis. In other words, most of the year’s adj. net losses occurred during the fourth quarter.
Looking at the Cash Flow Statement
But things are more clear in the cash flow statement. Their operating cash flow loss was $5.79 billion.
This is up from last year’s positive cash flow (cash coming into the company) of $682 million.

Click to Enlarge
You can see this in the printout and my circles of the operating cash flow portion of the 2021 Cash Flow statement on the right.
However, how did Opendoor finance this huge cash outflow of $5.8 billion (spent on buying homes)?
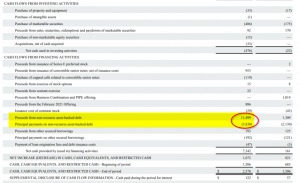
Well, the answer is seen lower down in the financing section of the Cash Flow statement.

Click to Enlarge
This shows that the company had to raise a whole bunch of debt, plus pay down some of the debt. It raised $11.5 billion in debt but paid down $5.8 billion. The difference is $5.7 billion in net debt raised.
That covers the $5.8 billion spent in the operating section to buy homes (see the operating section above).
But think about that for a minute. The $5.8b billion in home purchases was covered by the debt raised – not by any profits. Remember, the company lost a ton of money both on a GAAP and adjusted basis.
Therefore, the bottom line is that all the company did was leverage itself. There was no net gain in buying these homes (I am assuming it values its homes properly).
Bottom Line: Think Twice About OPEN Stock
There is no advantage to leveraging your balance sheet right at the peak of the market cycle for real estate. This strategy has huge risks.
For example, interest rates could skyrocket due to high inflation. Then real estate activity will decline, dragging down the value of the home inventories that Opendoor Technologies owns. That is its huge risk, along with the debt on its balance sheet, right now.
Most value investors will think twice about OPEN stock now. It’s not clear that this is a very good strategy.
After all, its competitor, Zillow (NASDAQ:ZG) got out of buying homes last quarter. They saw that this was the wrong strategy for them. I suspect that Opendoor Technologies may be forced into the same situation. That is likely why the stock is down so much.
On the date of publication, Mark R. Hake did not hold any position (either directly or indirectly) in the securities mentioned in this article. The opinions expressed in this article are those of the writer, subject to the InvestorPlace.com Publishing Guidelines.
Mark Hake writes about personal finance on mrhake.medium.com and Newsbreak.com and runs the Total Yield Value Guide which you can review here.
