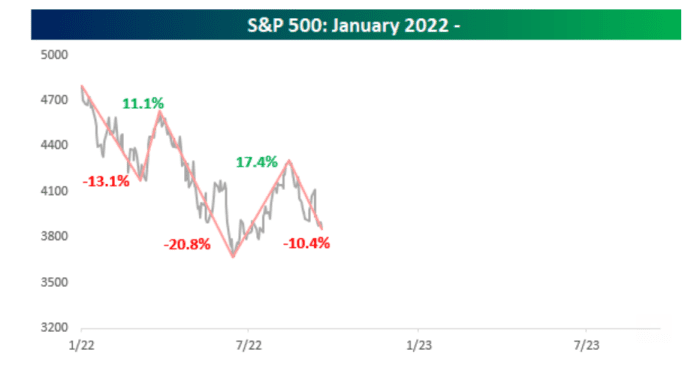
Stocks fell sharply after the Federal Reserve announced Wednesday that it was raising its benchmark rate by three-quarters of a percentage point as it battles inflation, with the S&P 500 continuing a slide described by Bespoke Investment Group as its third leg down.
“Where this bear market ultimately bottoms is anyone’s guess, and events outside of the Fed’s control will likely play a role in where the market finally ends up,” Bespoke said in a note emailed Wednesday. “In times like this, though, it’s always nice to look at how the current period compares to other periods, if for no other reason than to see how bad we have it or how much worse it can get.”
The S&P 500, which hit a record high on Jan. 3, has sunk 20.5% so far this year, according to FactSet data. The index dropped 1.7% Wednesday for its largest drop since Sept. 13, the day inflation data released for August came in hotter than expected.
The S&P 500 is down more than 10% from its August high, its third such leg down in the current bear market, according to Bespoke, though it’s still above its June low.
The firm studied past bear markets during the post-World War II period that began at all-time highs and saw at least three legs down of 10% or more before the S&P 500 ultimately bottomed. Those began in January 1973, November 1980, August 1987, March 2000 and October 2007, according to Bespoke.
“If there was one consistent pattern within all five of the prior periods highlighted, it is that in every one, the S&P 500 made a lower low in its third leg lower,” Bespoke said. The S&P 500 is not far above its June low, “so either the market has further to fall,” or if the index can rally back to 4,250, “it would offer some faint hope to bulls that the worst of the declines would be behind us.”

BESPOKE INVESTMENT GROUP
The S&P 500 on Tuesday closed down 10.4% from its recent high on Aug. 16, confirming “the index is in the third leg lower of at least 10% during the current bear market,” the Bespoke note shows.
“After some extreme oversold readings in mid-June, the S&P 500 rallied 17.5% through mid-August, but the rally failed just shy” of its 200-day moving average, the firm said. That same month, Fed Chair Jerome Powell’s clear message in his Aug. 26 speech at the Jackson Hole. Wyo., economic symposium that he would keep fighting inflation through tighter monetary policy even while causing pain to businesses and households, sparking a selloff in stocks.
The slump deepened after a stronger-than-anticipated reading on August inflation based on the consumer-price index, with investors questioning whether the S&P 500 will retest its June low.
Past bear markets
“The bear market that began in January 1973 and stretched to October 1974 was pretty relentless,” said Bespoke. The third leg lower then was particularly painful, as the S&P 500 declined more than 37% in a sell-off that only accelerated in August of that year after” the resignation of President Richard Nixon.
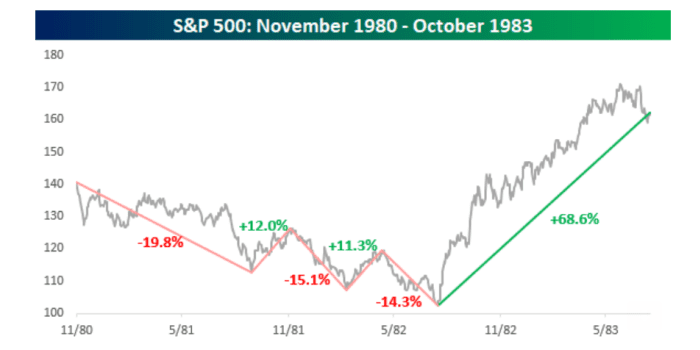
The bear market of 1980-’82 was notable for “the fact that the rally in the year after more than erased all of the previous declines,” the note shows.

BESPOKE INVESTMENT GROUP
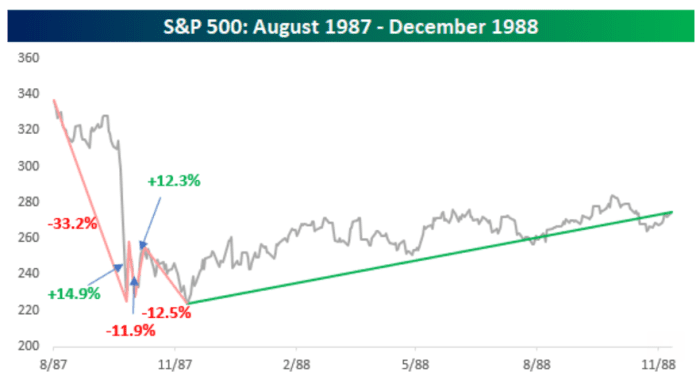
The 1987 bear market was as deep, but quick, spanning less than five months, Bespoke said. “This bear market was also unique in that it is the only one with at least three legs lower where each 10%+ decline didn’t result in a lower low.”

BESPOKE INVESTMENT GROUP
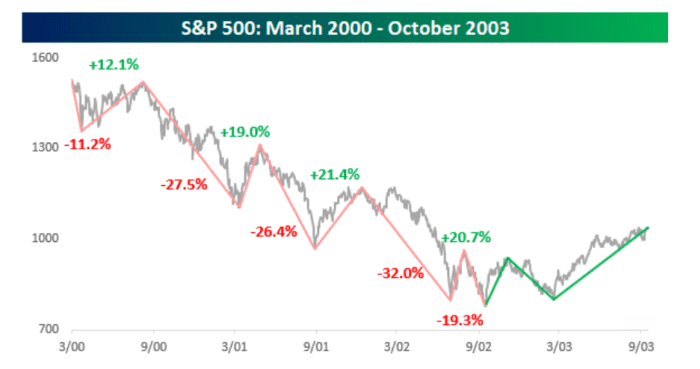
“Outside of the COVID crash, bear markets of the 21st century have been more drawn out,” according to the note.
From the peak in March 2000 through the October 2002 low, Bespoke tallied five separate legs that were at least 10% lower before the S&P 500 finally bottomed. “Most of them were severe,” according to the firm’s research.

BESPOKE INVESTMENT GROUP
More recently, “the bear market that began in 2007 included five separate declines of at least 15%, with three exceeding 25%, Bespoke said. The 18.5% rally from October to November 2008 was the only bounce of more than 10% during that period when the S&P 500 made a higher high, according to the note.
“Unfortunately for any bulls who pounced on that positive technical development at the time, it ended up being a major fake-out,” Bespoke said.
All three major U.S. stock benchmarks finished sharply lower Wednesday, as investors digested the latest large rate hike from the Fed as it aims to tame inflation through tighter monetary policy. The blue-chip Dow Jones Industrial Average
DJIA,
dropped 1.7%, while the technology-heavy Nasdaq Composite
COMP,
sank 1.8%.
Meanwhile, the S&P 500
SPX,
is approaching its 2022 trough. The index ended Wednesday up 3.4% from its closing low this year of 3,666.77 on June 16, according to Dow Jones Market Data.
Read: Fed predicts big slowdown in economy and rising unemployment as it battles inflation
