Inflation that’s accelerated well past the Federal Reserve’s 2% long-term target in the post-pandemic recovery poses a significant policy challenge. That has only gotten harder by an energy-price shock through the economy with unknown duration from the Ukraine conflict.
Inflation is the fastest it’s been in 40 years. The consumer price index surged 7.9% in the 12 months through February, the government reported Thursday.
The sources of faster inflation can be partitioned into the “macro demand” side and the “micro supply” side. There’s a popular myth that says massive demand has pushed up prices. But my conclusion is that the main culprit is the supply side.
As a result, it’s not a surprise to see policies that attempt to boost the capacity of the economy. Demand-side policies can be switched on and off in concert with the business cycle, but supply-side initiatives involve a range of players and take longer to yield results.
Let’s break down this issue.
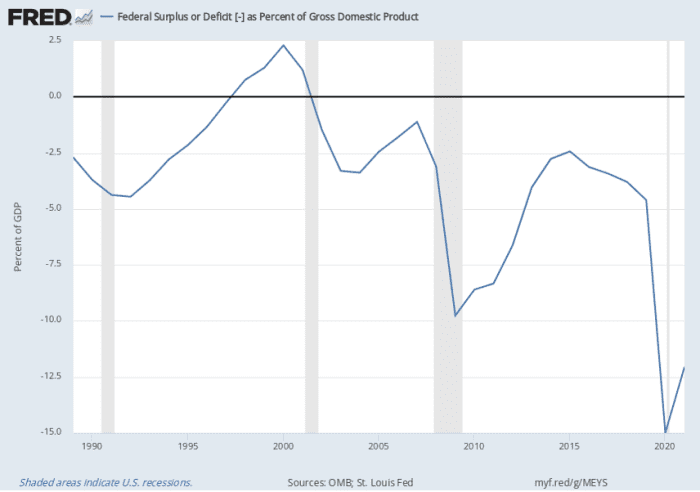
Fiscal policy: There’s no question that a massive amount of fiscal stimulus was injected into the economy in the second half of 2020 and in 2021. The federal deficit increased from 4.6% of gross domestic product (GDP) in 2019 to 15% in 2020. The difference represents the largest fiscal stimulus on record since WWII — much bigger, even, than during the devastating recession of 2008-2009.
The scale of the fiscal stimulus was disproportionately out of line with the two-month “micro” recession in the second half of 2020. The outsized scale of the stimulus was a fundamental misread of the sharp jump in the unemployment rate, which was almost entirely connected with large-scale, but temporary, layoffs. There were no mass firings, as some experts had expected. Thus, there was a significant overpayment of unemployment benefits, which are now in the process being taxed back.
The stimulus led to a jump in the federal-debt-to-GDP ratio of close to 101% at the end of 2021. But in 2022 we are now seeing a major reversal of the fiscal deficit due to the strong force of the recovery. The fiscal deficit is projected to decline to near 4.5% of GDP in 2022, a third that of 2020. There’s now a major fiscal drag, as opposed to a major fiscal stimulus. And that’s been intensified by inflation.
The prospective persistence of inflation in 2022, therefore, is not connected with the current stance of fiscal policy.
Monetary policy: The Federal Reserve left no stone unturned in finding ways to stimulate the economy, with interest rates slammed to zero percent, and a broad range of targeted programs, which successfully reversed the huge jump on risk spreads on corporate and municipal borrowing in March and April 2020. With massive quantitative easing (QE), the Fed’s balance sheet has doubled since the fall of 2019 to nearly $9 trillion.
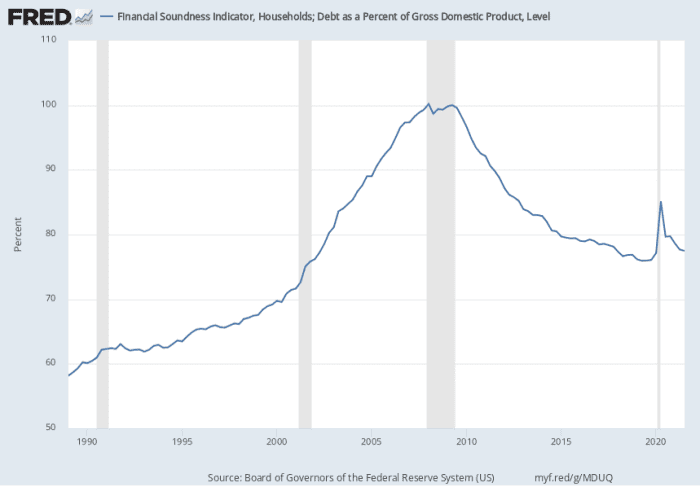
With all of that monetary stimulus, however, we have not seen private debt explode. Total household debt expanded by 3.8% in 2020 and by about 6.5% in 2021. Those are well below the “yellow flag” of growth rates in excess of 10% for an extended period during the housing bubble. The household-debt-to-GDP ratio was 77% at the end of 2021, a rise of only 1 percentage since the fourth quarter of 2019 and well below the peak of 100% just prior to the 2008-2009 collapse.
There was a brief jump in business debt in the second and third quarters of 2020, as corporations issued debt during that brief window of exceptionally low borrowing rates, but the growth of business debt decelerated sharply in the second half of 2002 through 2021, and corporate debt/equity ratios continued to march downwards to historically low levels in 2021.
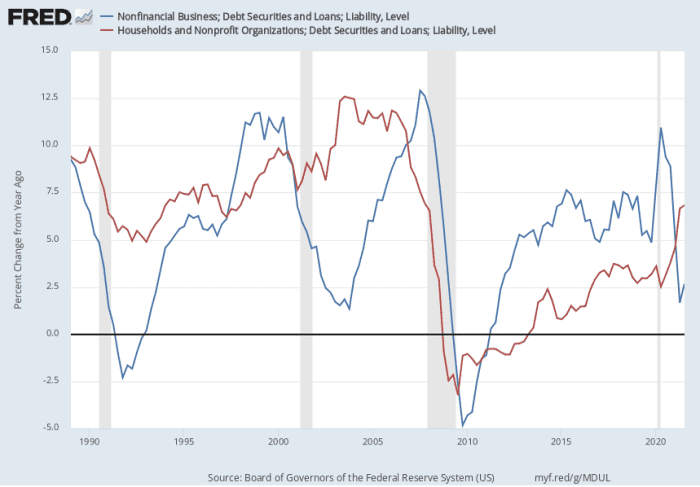
Despite the massive monetary stimulus that was unleashed in response to the pandemic, there has been no disproportionate acceleration in the levels of household or business debt during the recovery.
Where did all that liquidity go? Since the fall of 2019 there was a massive $2.4 trillion increase in bank reserves at the Fed, liquidity that has been effectively captive in the banking system.
With respect to industry and trade micro policies, there are two structural policy trends that have played out to exacerbate supply chain challenges, as well as a recent shift in relative occupational risks.
With respect to trade, a “shotgun” series of product- and country-specific tariffs were imposed starting in February 2018. The product range included solar panels, washing machines, steel and aluminum, and then three phases of tariffs on imports from China. Those tariffs had a negative impact on the input costs of industries that use those products. They also provided a tariff wedge of protection for the domestic industries that were producing comparable goods.
All in, economists estimate that these measures led to an increase in manufacturing producer prices of about 1% in 2018, with most of the pain passed on to U.S. consumers and importers.
Additional costs beyond that were connected with reorganizing supply-chain sourcing, reduced consumer choice, and the impact of policy uncertainty on sourcing and investment planning decisions. The steel and aluminum tariffs on Canadian and Mexican imports were eliminated in May 2019 and replaced with import quantity limiting quotas. Tariffs on European Union imports were converted to similar bilateral tariffs related quotas in October 2021.
Perhaps more striking in terms of the supply side is the systematic increase in industry concentration in the U.S. in the first two decades of the 21st century. The increased concentration in the banking industry was partly the consequence of the 2008-2009 banking crisis, which led to a wave of mergers and consolidations, and this was followed by further strategic mergers of regional banking groups into larger entities.
A recent study reported that over 75% of U.S. industries have seen an increase in concentration levels from the late 1990s, and industries with the largest increases in concentration showed higher profit margins and more clout in further mergers and acquisitions deals.
Consistent with these trends towards higher concentration, the number of publicly traded firms has declined significantly, from a peak of over 7,000 in the late 1990s to below 4,000 in 2015. In addition, the global semiconductor industry is highly concentrated among a few key players, and U.S. producers are struggling to stay in the lead pack on R&D and innovation.
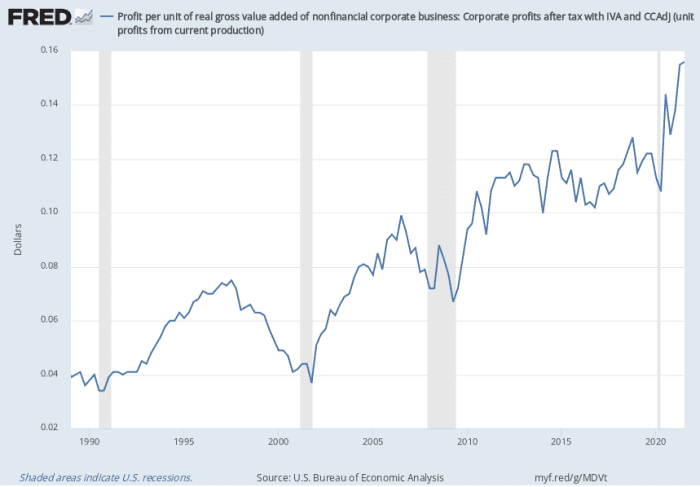
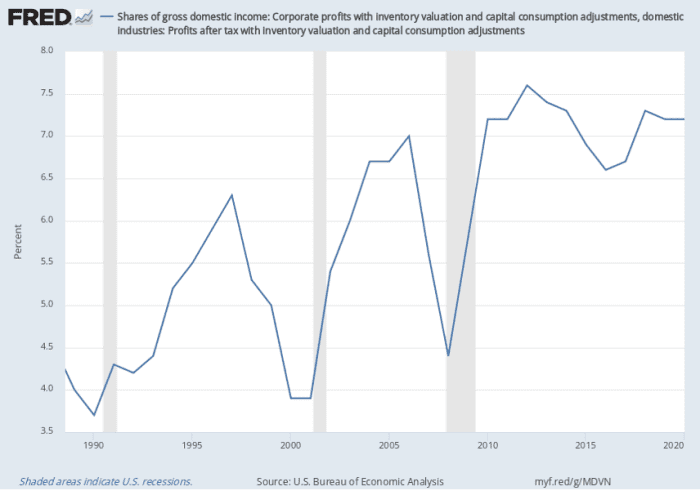
The result of higher industry concentration is an increase in profit margins. Profit per unit of real value added of nonfinancial corporate business rose from 3.7% in 1990 to 12.4% in 2021, while profits as a share of gross domestic income rose from 3.7% in 1990 to 7.2% in 2020.
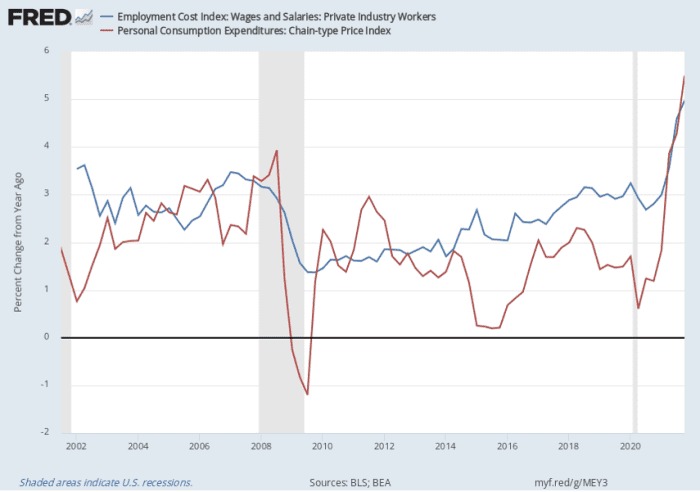
With respect to other supply-side myths, there is absolutely no evidence of any cost-push wage inflation. Once you control for occupational shifts, the employment cost for wages and salaries rose at an annual rate of 2.8% in the fourth quarter of 2020 and 5% a year later. The personal consumption deflator rose by 1.2% and 5.5%, respectively. Thus, real wages have expanded by only 0.55% a year in 2020 and 2021, compared with output per hour productivity growth 2.6% in 2020 and 2% in 2021.
Average weekly earnings for leisure and hospitality workers, which were only $433 per week prior to the pandemic in the fourth quarter of 2019 rose to $505 per week two years later. For education and health services, average weekly earnings rose from $919 to $1,031 in the same periods.
This is not a “hot” labor market. Given the quantum increase in risk of working in these industries during the pandemic, should there not be a significant increase in risk-adjusted pay? Would you want to walk into a Covid ICU unit in a hazmat suit, or serve drinks to irate and unruly masked passengers in a commercial airliner, with no increase in pay?
If we depart from a fundamental “higher risk = higher reward” standard, then the whole edifice of value creation and innovation-driven growth collapses and we will become the slaves of despots.
Brian Bethune is an economics professor at Boston College.
